A Visual Guide to Using the CEDAC Problem Solving Method
Pic: CEDAC DIAGRAM TEMPLATE.
CEDAC is an acronym for Cause-and-Effect Diagram Adding Cards; a collaborative problem solving method based on the fishbone diagram, developed by Ryuji Fukuda and presented in his book, CEDAC: A Tool for Continuous, Systematic Improvement.
This analytical method helps improvement teams visually identify, categorize, prioritize, and address their organization’s most critical problems through collaborative root cause analysis and brainstorming.
CEDAC enhances fishbone diagrams by using color-coded cards to tell a compelling problem solving story, is especially effective when incorporated into the A3/DMAIC structure, and used during a rapid improvement event (“RIE”).
CEDAC Steps
1. Identify a Problem to Investigate and Area to Observe.
What is keeping you up at night? Select an area that is dealing with issues in one or more of the company’s key result areas (“KRA”). This may include Safety, Quality, Time/Delivery, Customer Satisfaction, Productivity, and Financial.
Generally, improvement teams use CEDAC to address gap from standard problems—which arises when a process fails to achieve its’ planned performance.
For example, imagine your process lead time is much longer than the standard/expectation; this indicates there is a gap from standard that must be addressed.
2. Select Team and Appoint Roles and Responsibilities
To ensure the CEDAC exercise stays on track and the team remains engaged throughout, it’s recommended that the company enlists support from a skilled facilitator (often an outside consultant) to guide the process, as well as team champion with decision-making authority in the area to own the CEDAC, corresponding improvement plan, and hold the team members accountable.
The champion is also responsible for selecting and inviting the team members.
CEDAC teams are cross-functional, including people responsible for the process, as well as some individuals from other areas. The former will possess the knowledge of the current state. The latter will provide an outside set of eyes tasked with challenging the process owners with raising existing standards.
Subsequently, the facilitator and champion assign each team member with pre-event tasks (often involve data collection or retrieving standard work), as well as specific roles and responsibilities for the CEDAC event (i.e., scribe, camera operator, interviewer, time keeper, parking lot attendant, etc.)
3. Create Visual Area for CEDAC Diagram.
Effective CEDAC diagrams are interactive and kept in a visible, centralized location, so others in the organization can come see, discuss, and, learn the method.
A template for creating your very own CEDAC.
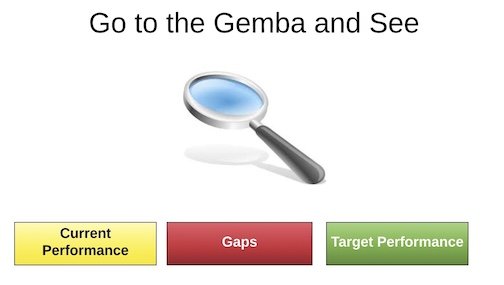
4. Go to the Gemba for Direct Observation
The Gemba is the Japanese term for real place—anywhere where value-creating work occurs. The Gemba is where the action is and it can take many forms: shop floor, office, job site, emergency room, kitchen, virtual meeting room, etc.
Going to the Gemba describes the practice of thoroughly understanding a condition by confirming information or data through personal observation at the source. The practice of direct observation enables the team to gather facts and real-time data first-hand, rather than relying on their perceptions and hearsay.
Consequently, even if the CEDAC diagram is displayed in a conference room, the team will spend a significant amount of time and “go see” where value is created. The success of the CEDAC exercise relies on the team’s ability to accurately identify and analyze the current reality.
5. Draft Problem Statement
After initial observation at the Gemba, the team will formulate a problem statement. Problem statements address the overall purpose of pursuing the CEDAC effort and clearly describe the current gap in performance. The problem statement should be positioned to the top right of the diagram.
To draft a problem statement, consider the following:
What is the problem (gap in performance)?
Where is the problem occurring?
What’s the magnitude of the problem?
Why is it important to solve this problem?
Depending on the size of the team, it may be helpful to split into 2-3 teams to draft the problem statement separately, then combine the key points into one statement. This approach will ensure team members avoid the dangers of groupthink and confirmation bias.
Problem Statement Example
SKU #123’s (our biggest seller) defect % from the past quarter is at 5% even though the expected condition is 3 %.
This gap from standard in quality has led to extensive time being spent on rework, extended lead times, a consistent inability to make on-time deliveries, vociferous customer complaints, and excessive labor costs.
By addressing this critical problem, the company can drastically reduce the SKU’s lead time, meet delivery dates, eliminate most customer complaints, and significantly cut costs.
6. Go to the Gemba to Measure Current State.
Problem statements are based on a somewhat superficial understanding of the problem, so the team is now tasked with collecting facts and data that impact the applicable KRAs and presenting them in a visual format.
It’s time to return to the Gemba to walk the process again.
The KRA and corresponding metrics could be:
Safety: Incident rate, near misses, or compliance rate.
Quality: Percent of defective products, rolled throughput yield, or rolled throughput yield, or rework %.
Time: Lead time, changeover time, or on-time delivery.
Customer Satisfaction: Number of complaints, survey results, or net promoter score.
Productivity: Process throughput, overall equipment efficiency, or revenue per employee.
Financial: Net income, net profit margin, or gross profit margin.
For example, if the selected KRA is Quality and metric is percent of defective products, capture this in a chart and display it adjacent to the CEDAC.
7. Select Target Conditions.
Target conditions state how accurately and precisely the team hopes to hit a specific target and include:
KRA(s); metric(s); current state; tangible improvement goal(s), and a target date.
Target Condition Example
By reducing SKU #123’s defect % from 5% to 2.5% by 2024 and sustaining the improvement throughout the year, the company will greatly improve customer satisfaction by consistently meeting on-time-delivery, slash 50% of the order to delivery lead time, and cut labor costs by an estimated $75,000 per year.
8. Create Visual with Target Condition
I didn’t feel like updating this visual so imagine it says August 1, 2024. Thanks, guys.
9. Identify and Document Observations RE: Potential Causes on Fact Cards.
The yellow cards are referred to as fact cards and serve the purpose of capturing the observations team members make related to addressing the problem statement and reaching the target conditions.
Brain-Writing
Prior to collaborative brainstorming, it’s recommended for the facilitator to guide a brain-writing exercise, this is essentially a “silent ballot” method, allowing each individual member to make observations independently.
Team members are now responsible for capturing their observations on each fact card, adding their intitials/date to the bottom, and moving each card to the left side of the CEDAC.
Once each team member fills out their fact cards, the team can reconvene and begin the more traditional brainstorming process.
Remember, the goal for this exercise is for team members to identify as many observations as possible, then for the team as a whole to build off each other’s ideas.
10. Review and Categorize Fact Cards
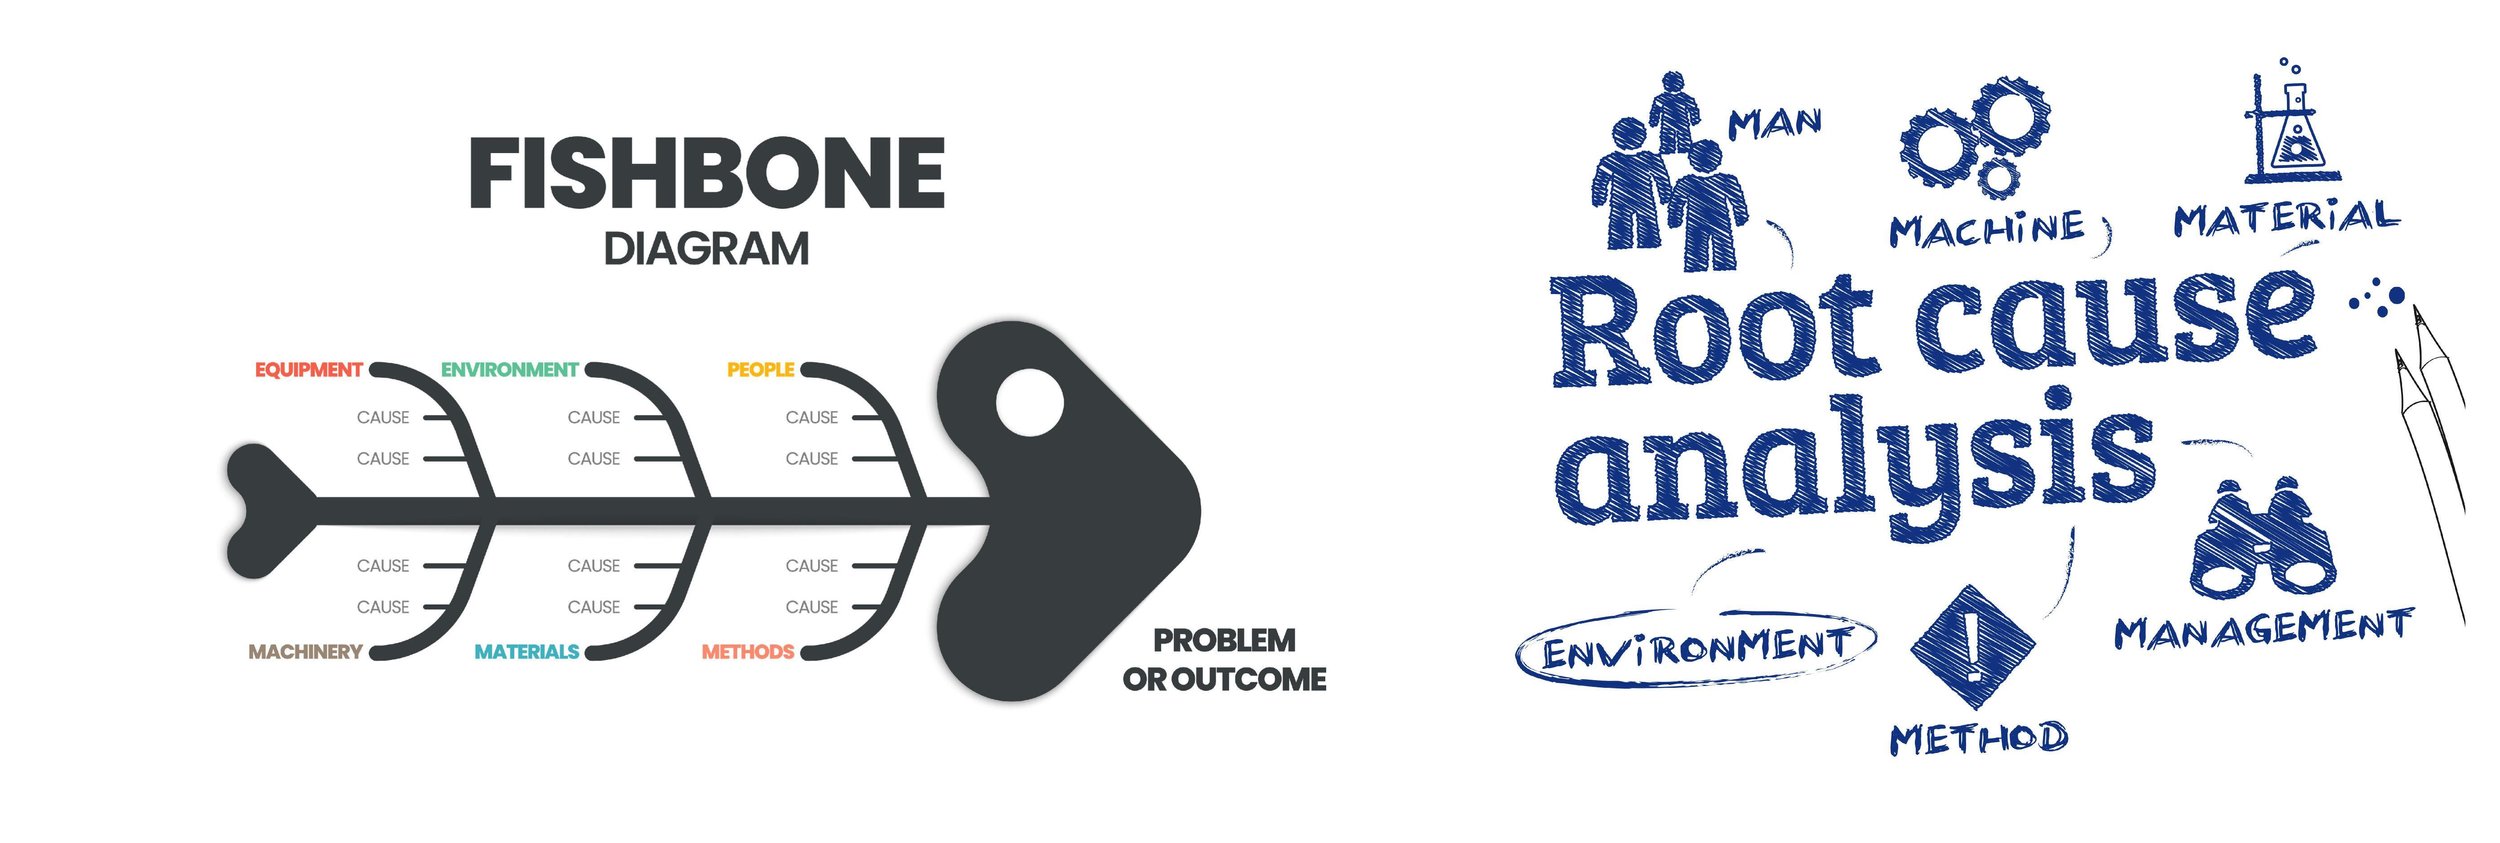
The next step consists of grouping the fact cards into logical categories that serve as the branches for the CEDAC. The 6 Ms (Manpower, Machine, Method, Material, Management, and Mother-Nature/Environment) is popular in production-based environments, whereas, organizations in the service sector may be inclined to use the 7Ps (Product, People, Process, Promotion, Price, Physical evidence, and Place).
It isn’t necessary to follow any particular categorization model, as long as fact cards are group under recurring themes that directly contribute to the problem statement.
11. Use 5 Whys to Uncover Root Causes
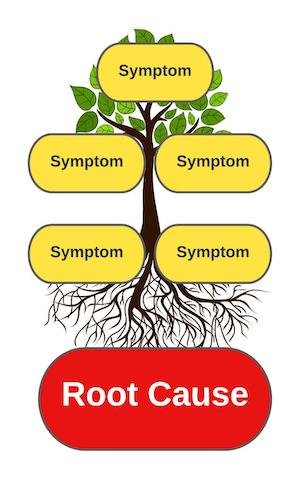
At this stage of the CEDAC exercise, the team most likely identified several potential causes of the problem that fit under one or more categories. Prior to brainstorming potential countermeasures (AKA jumping to solutions), the team breaks down the problem through root cause analysis.
A root cause is the fundamental breakdown or failure of a process which, when resolved, prevents a recurrence of the problem—it’s the dominant contributor to the problem’s existence. Rather than focusing on identifying and addressing the symptoms of the problem, root cause analysis involves a more thorough review.
The Five Whys is the simple, yet analytical practice of repeatedly asking why whenever a problem is encountered, with the goal of discovering its’ root cause.
“A relentless barrage of whys is the best way to prepare the mind to pierce the clouded veil of thinking caused by the status quo. Use it often.”
On the right side of the gallery below, you’ll see a famous example from Taiichi Ohno, the architect of the Toyota Production System.
12. As a team (or independently), list improvement ideas (potential countermeasures) that address each identified root cause on green cards and place on the right side of the CEDAC fishbone.
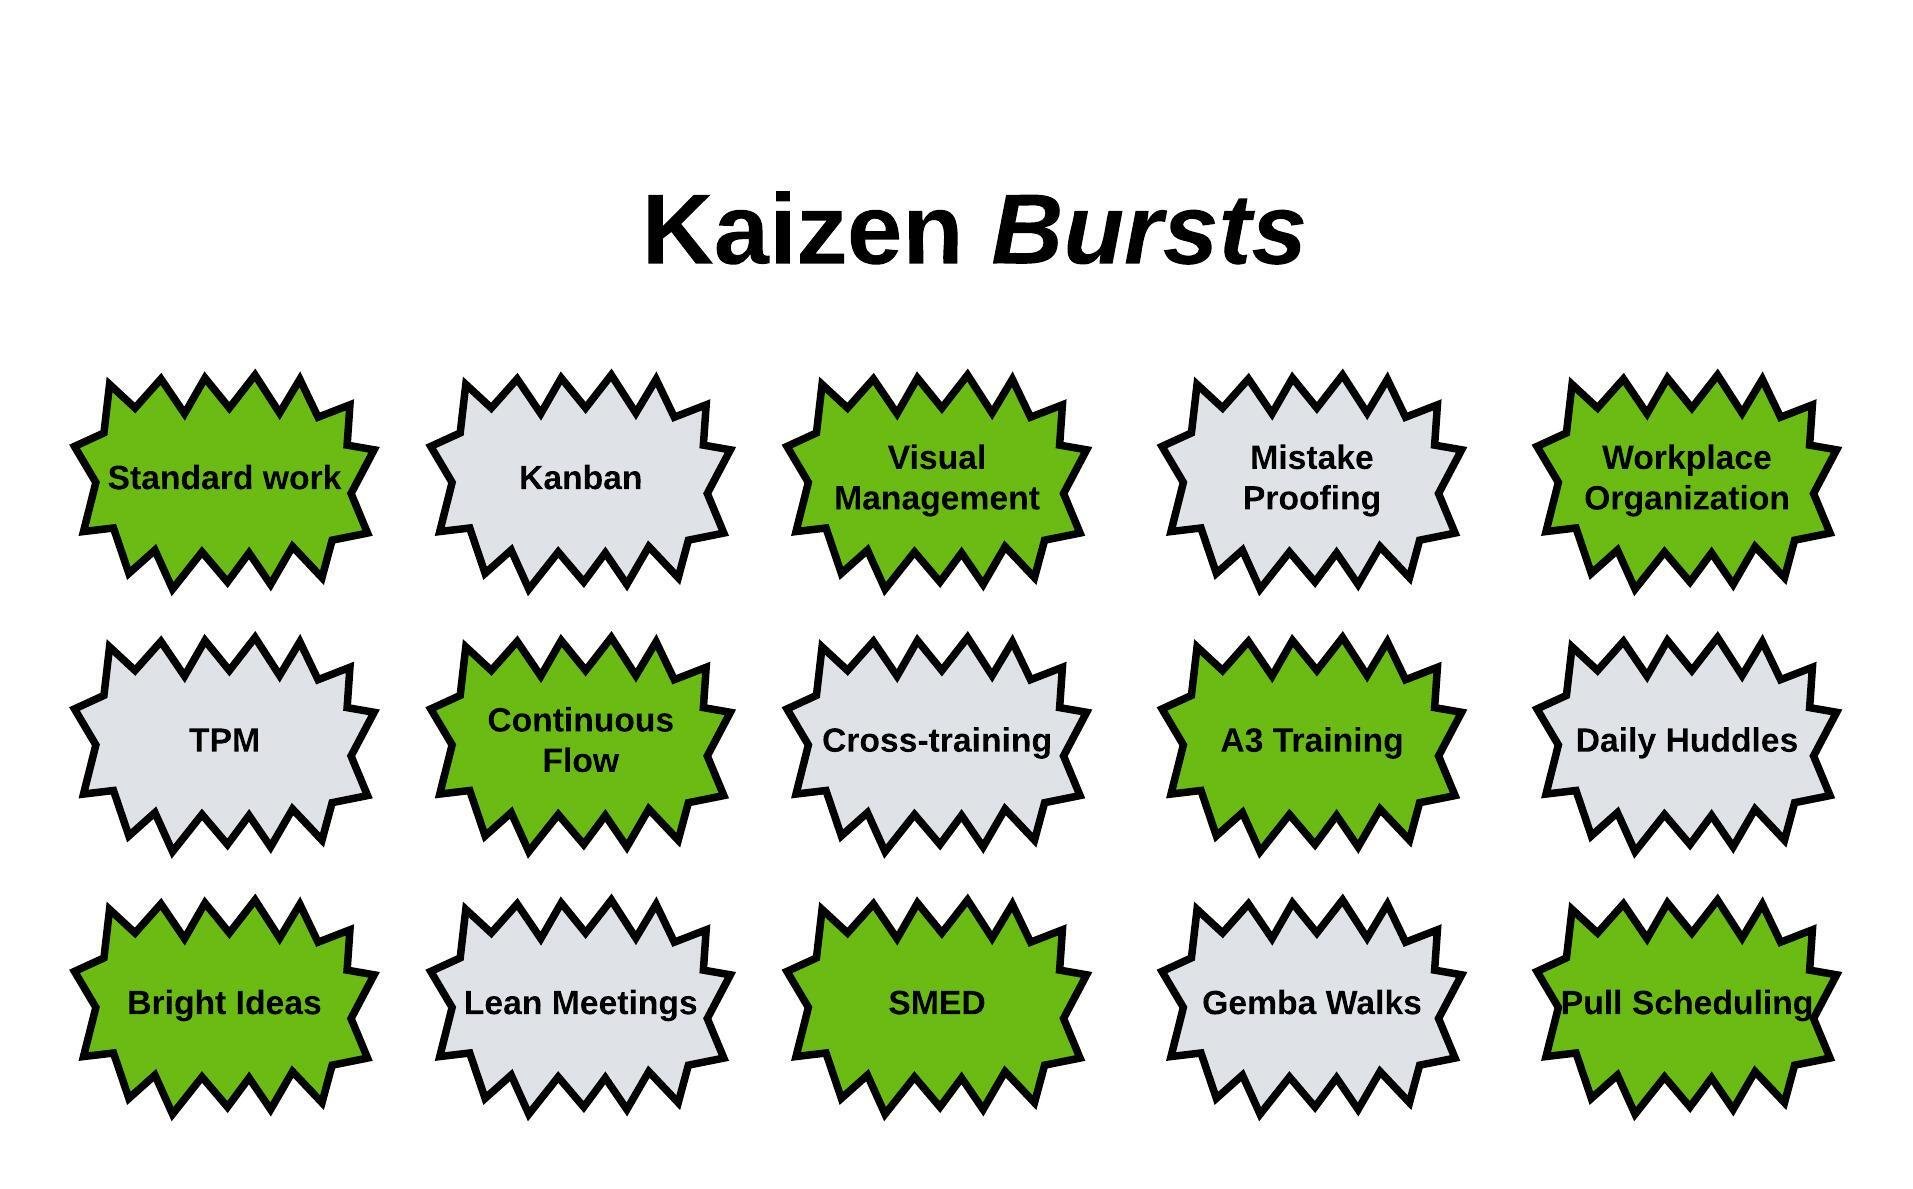
Illustration of examples of kaizen bursts.
Lean practitioners often refer to these countermeasures as Kaizen bursts; the proposed action items designed to help the team bridge the gap between the problem statement and its’ corresponding target conditions.
Similarly to the process for creating fact cards, each team member should to start generating ideas independently prior to collaborate as a group; this sequence ensures that the individual team members are uninfluenced by their peers, promoting a list of diverse and creative countermeasures.
During this phase, each team member is responsible for filling out as many green cards as possible, posting their proposed countermeasures on the fishbone’s right side. It may make sense to schedule the team’s collaborative brainstorming session for the following day to allow the team to think deeply.
When the team reconvenes to brainstorm, the objective is to build upon each other’s ideas.
13. Use the 3-Dot Method to Evaluate, Prioritize, and Select Countermeasures.
Once the team brainstorms as many improvement ideas (proposed countermeasures) as possible, it’s time to evaluate and prioritize these ideas. The 3-Dot Method is a useful visual control that accelerates this process.
The proposed countermeasures fall under the the following categories:
A. Of interest: Might not be practical or possible at this time.
B. In prep: Requires some planning before testing.
C. Under test: Actively being tested.
D. Selected: Will become a new standard.
If after testing the potential countermeasures, it becomes apparent that they should NOT be implemented (will not work as new standard), the team should indicate this by writing an “X” on the card.
14. Implement Improvement Plan to Achieve Target Conditions
After thoroughly evaluating each proposed countermeasure through the 3-dot method, it’s time to implement the improvement plan. The selected cards become the New Standards that form the improvement plan.
15. Implement the New Standards
Countermeasures that require technology are often more difficult to quickly implement, its’ recommended for the team to begin with low cost countermeasures that can be applied immediately. This is one of the advantages of using the CEDAC as part of a rapid improvement/kaizen event. Since time is already blocked off and dedicated for process improvement, the team can get started on executing its improvement plan.
16. Monitor Improvement Plan
Once the team completes the action items (could take 1 day to several weeks, depending on scope), it’s critical that the group reconvenes to monitor their results.
The key questions to ask at this stage are:
✅ Did we achieve our intended results?
✅ Did we bridge the gap from standard?
✅ Do we need to adjust our plan? If so, what should we try instead?
If the countermeasures didn’t provide the desired effect, the team will need to reconvene and amend their improvement plan with additional experiments.
17. Celebrate Success!
Imagine the team met it’s goal. Before targeting the next problem, they deserve to celebrate their success and share their problem-solving journey with their peers. if the goal wasn't met, the celebration will be more about about what they learned and how they will do things differently next time.
18. Raise the Bar
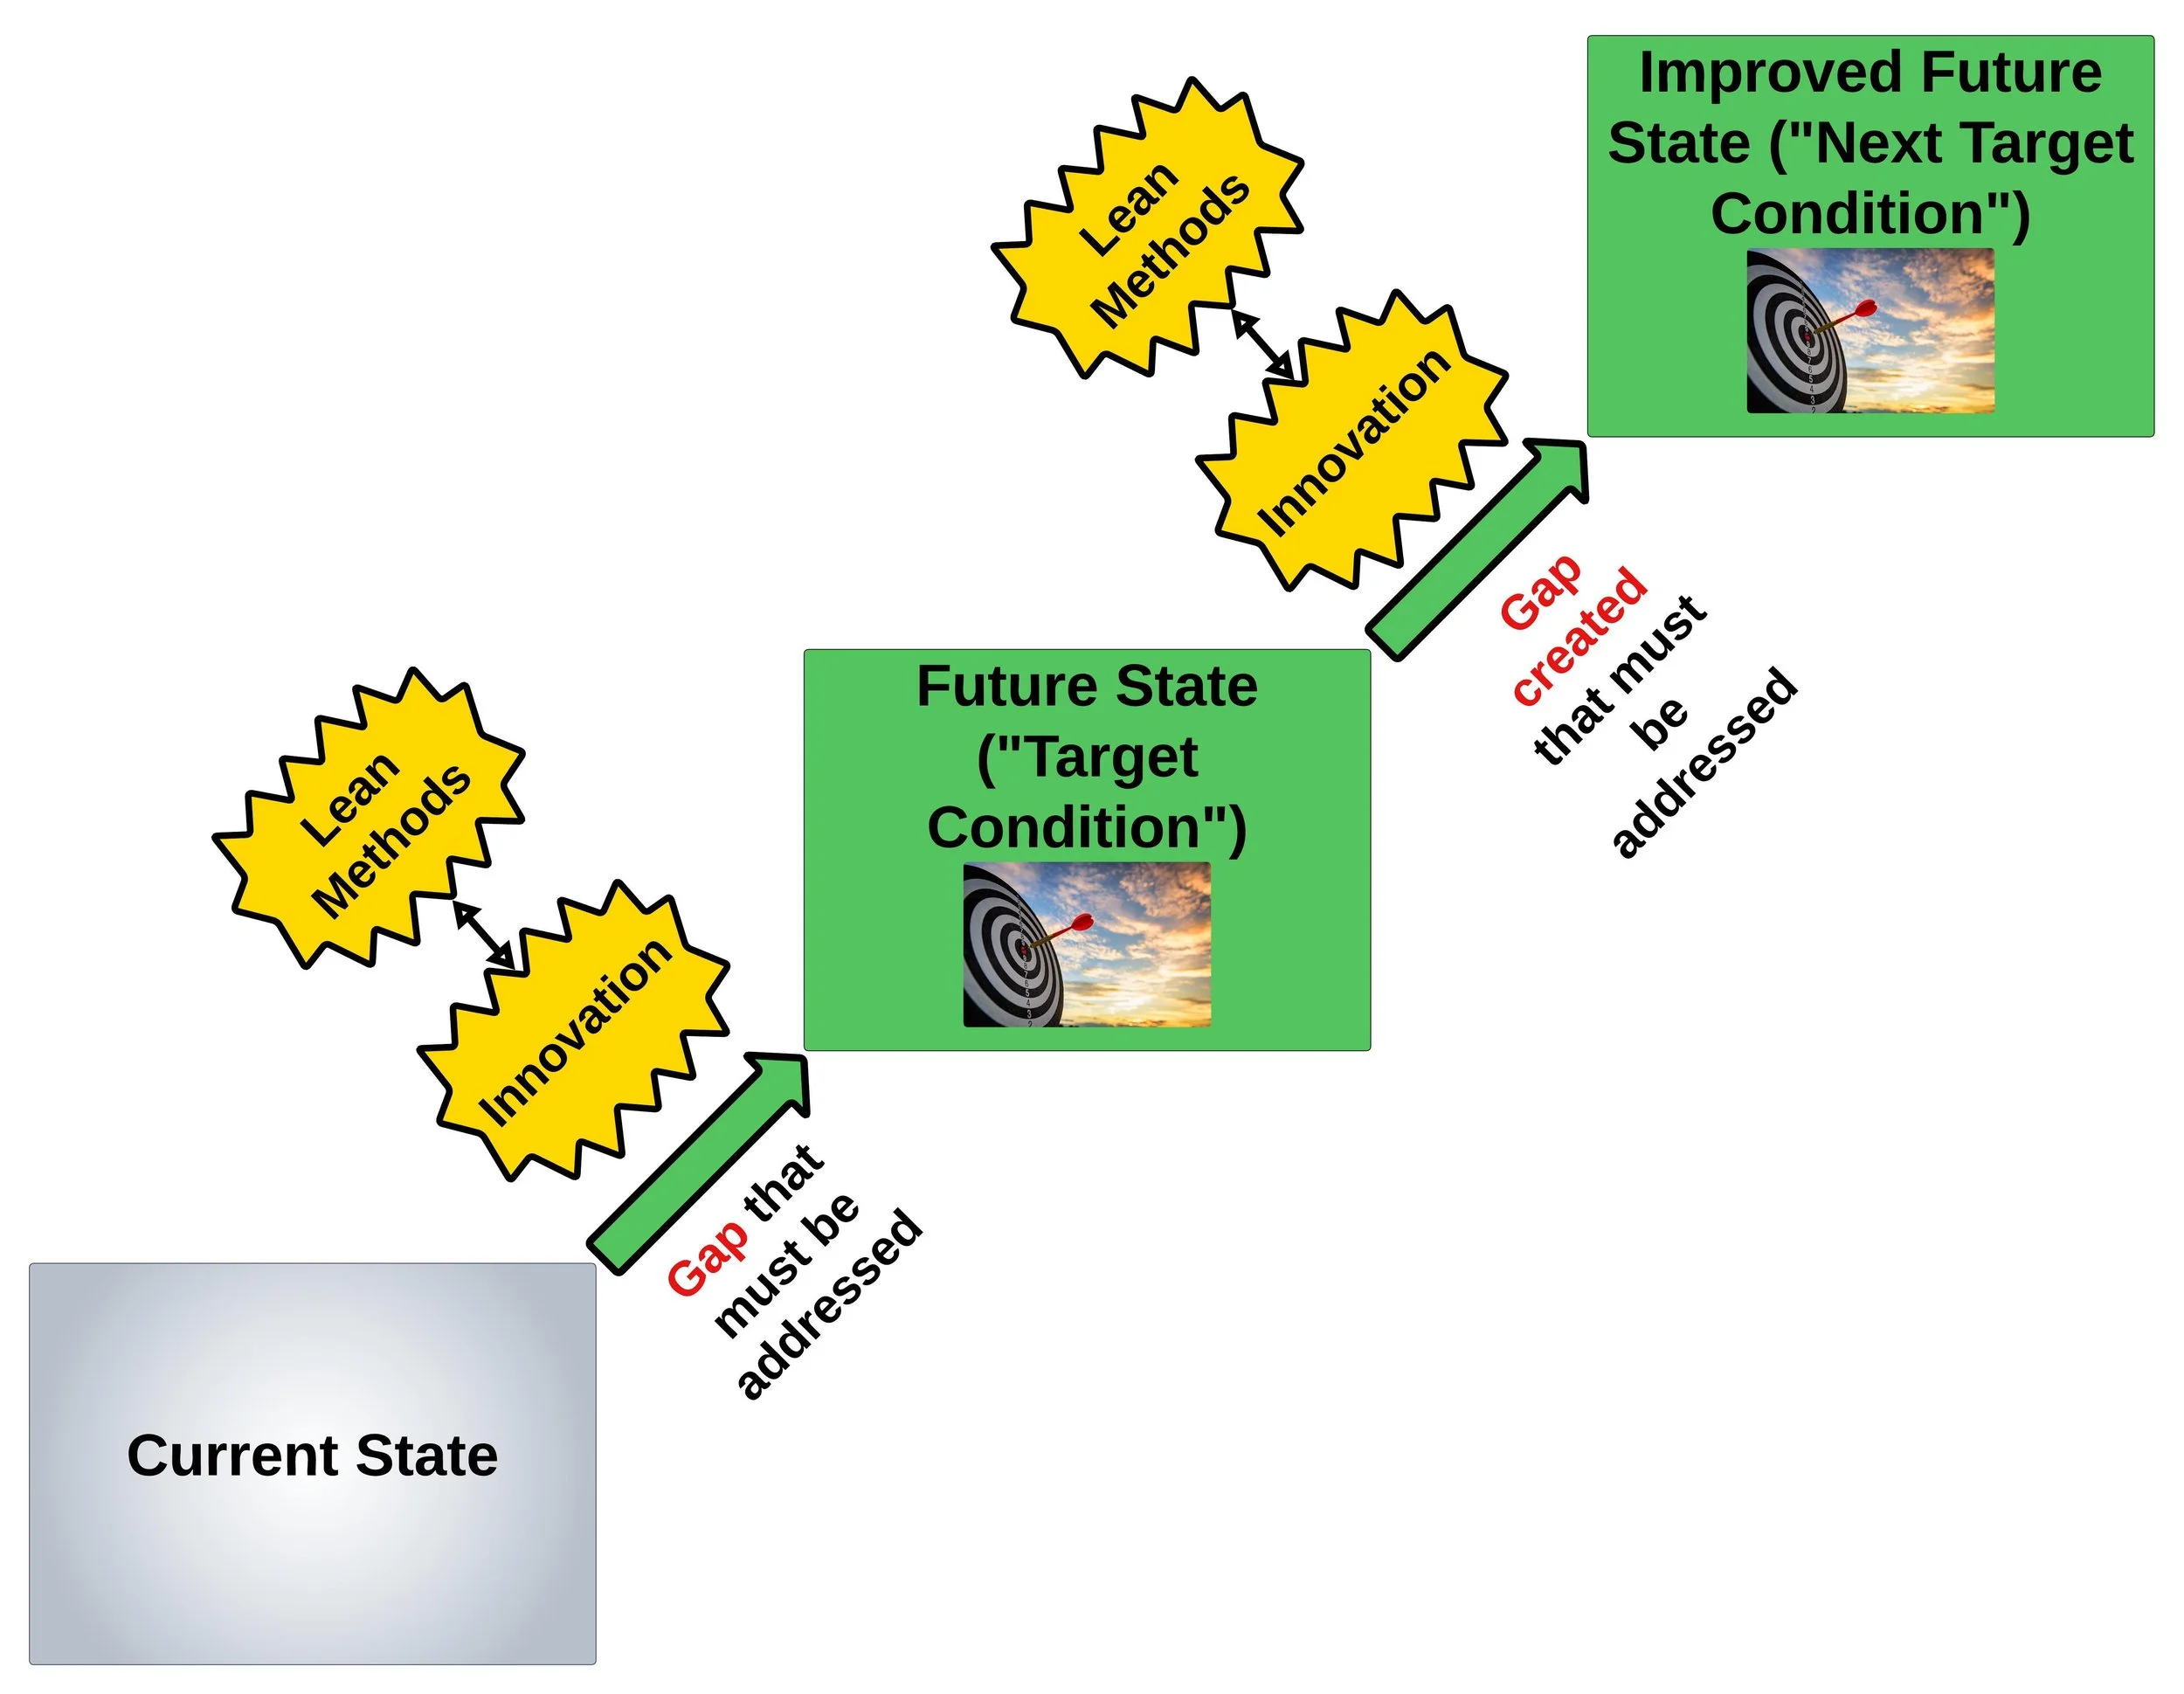
Since SKU #123 is the product most vital to the company’s future, the team has decided to focus its upcoming improvement efforts on raising the performance bar.
The old target condition (2.5%) is the new current state and the new target condition/future state is now 1.5%.
A kaizen culture never sleeps.
CEDAC Tips
✅ Prioritize critical problems. ✅Incorporate CEDAC into preexisting A3 and RIE standard work.
✅ Use a facilitator to guide problem-solving exercise. ✅ Engage team of subject matter experts and a few outsiders.
✅ Make it visual and interactive. ✅ Go to the Gemba multiple times.
✅ Set stretch target conditions. ✅ Conduct root cause analysis.
✅ Use brain-writing approach to identify potential countermeasures.
✅ Monitor and adjust CEDAC process accordingly.
✅ Share and replicate CEDAC process as indispensable problem-solving method.
#CEDAC #rootcauseanalysis #problemsolving #continuousimprovement #kaizen
